In the industrial and multimedia markets, managing loud noises is crucial to ensure good performance in audio systems. There are many techniques for attenuating sound hitting a microphone, but when the microphone is about to clip, the attenuation must be designed into the acoustic domain.
The goal of this article is to present a mechano-acoustic system that is well known in the industry: the stiffness-controlled diaphragm.
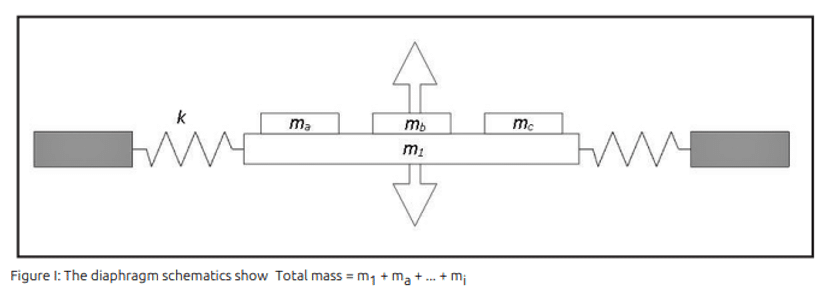
As shown in Figure 1, from the article by B. Fazenda and K. Griffiths [1], resonant diaphragms can be approximated by means of the damped mechanical mass-spring system.

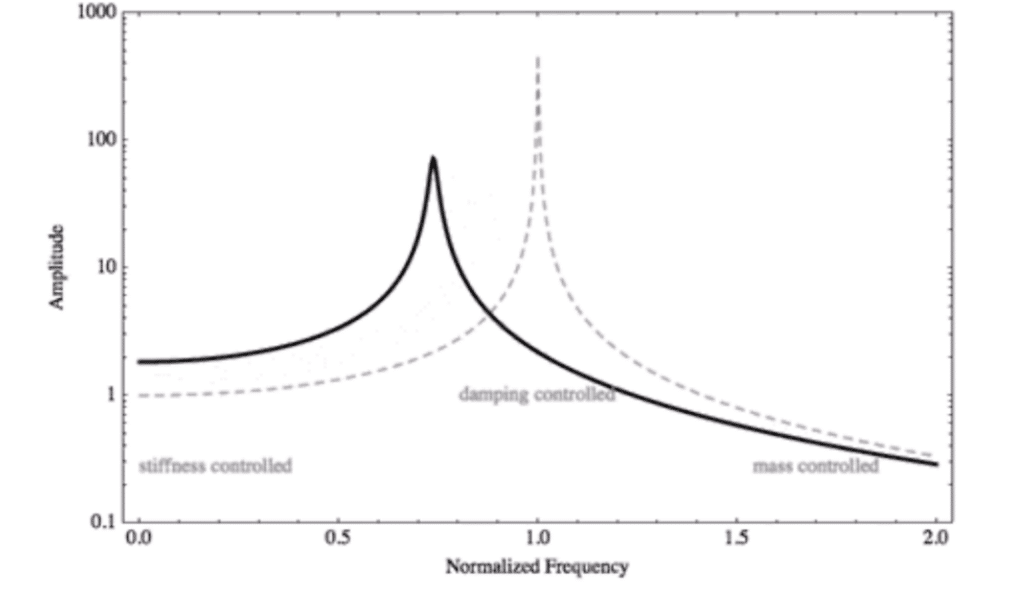
From the behavior of such a system, we know that the region around its resonance frequency can be divided into three zones:
– a region at the resonance controlled by the damping
– a mass-controlled region above resonance
– a stiffness-controlled region below the resonance.
Figure 2, from an article by D. Russell [2], illustrates these three zones for a system for which the normalized displacement x is calculated using the following formula:

F0 represents a normalized mechanical force (issued from the incoming acoustic wave in our case)
m represents the moving mass of the diaphragm
β represents the damping factor of the diaphragm
Ω represents the frequency
Ω0 represents the resonance frequency and is defined = √(k/m) with k the diaphragm stiffness.

From this figure, we first understand that the displacement of the diaphragm below the resonance remains the same regardless of the frequency, but it also depends on the overall stiffness of the system. A decrease in stiffness for the system will result in both a decrease in resonance and an increase in diaphragm displacement. Conversely, an increase in stiffness will produce the opposite effect.
The relationship between displacement and acoustic attenuation can be predicted using the Lumped Element (LE) approach. Figure 3 below illustrates the LE network of the diaphragm which shows the mechano-acoustic couplings between incoming and outgoing pressures.

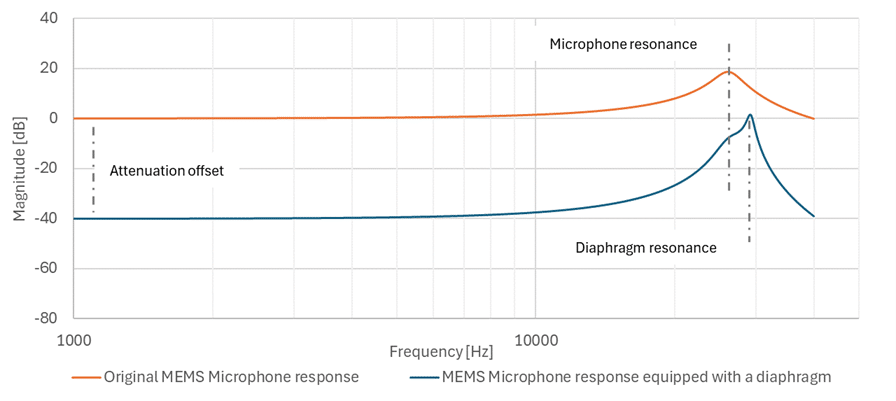
By applying this network model to the response of a MEMS electrostatic microphone, we can predict its attenuated frequency response and compare it to the original response, like shown in Figure 4.
On this graph, the original microphone response is normalized to 1 kHz (orange curve) to evaluate the attenuation created by the diaphragm in the sound channel (blue curve). We observe that the system considered in example here provides a flat attenuation offset of 40 dB and slightly shifts the resonance frequency to the right. Such observed flat attenuation is a typical behavior of this system, in contrast to porous materials (e.g. dampers), which generally provide increasing attenuation with frequency.

Let Seltech assist you in designing the correct attenuation solution for your device!
Review by:
Frédéric Fallais, Acoustic Application Engineer
Arthur Di Ruzza, Acoustic Technician
Sources:
[1] B. Fazenda et K. Griffiths, «The Diaphragm Absorbers».
[2] D. Russell, «Acoustics and Vibration Animations: Regions of Resonance,» 22 06 2019. [En ligne].
Available: https://www.acs.psu.edu/drussell/Demos/Resonance-Regions/Resonance.html. [Accès le 02 08 2021].

